
Hotspots are silent performance killers in distributed databases. They rarely trigger alerts — instead, they quietly erode throughput, increase tail latency, and leave your engineering team guessing. If you’re running TiDB at scale and suddenly one TiKV node is running hot while others sit idle, you’re likely facing a hotspot.
In this post, we’ll walk through how to identify and diagnose hotspots in TiDB using TiDB Dashboard, Top SQL, and system tables. Whether it’s due to schema design, indexing quirks, or concentrated traffic on specific keys, we’ll show you how to spot trouble early — and fix it fast.
Understanding Performance Hotspots in TiDB
In a distributed SQL database like TiDB, data is broken into regions — small chunks of the keyspace — and distributed across multiple storage nodes (TiKV or TiFlash). When too much traffic is focused on a small subset of that data, one or more nodes can become overloaded. These “hotspots” create performance bottlenecks that degrade throughput and response time.
There are two common causes:
- Data Skew: Data is unevenly distributed across regions — often because of schema design. For example:
CREATE TABLE t (
    a BIGINT PRIMARY KEY AUTO_INCREMENT,
    b VARCHAR(255)
);
This schema inserts data sequentially on Column A, concentrating on new rows in the same region. This gradually creates a write hotspot on a single TiKV node while others remain underutilized.
- Hot Key Access: A small number of rows (or even a single key) becomes a traffic hotspot — whether due to user behavior, reporting queries, or a poorly cached endpoint. When traffic patterns are skewed like this, the region holding that key becomes a bottleneck.
Both of these patterns can result in excessive CPU usage, long-tail latency, and degraded cluster performance.
Identifying TiDB Performance Hotspots via Monitoring
Diagnosing performance hotspots in TiDB starts with visibility. You want to pinpoint which nodes or queries are under pressure — and why. TiDB Dashboard provides multiple ways to uncover these issues, especially through TiKV CPU metrics and Top SQL.
Spot Hot Nodes Using TiKV CPU Metrics
Start by looking at CPU usage across your TiKV nodes:
- Open TiDB Dashboard and go to the TiKV CPU section.
- Look for nodes with significantly higher CPU usage than others.
- Click into those nodes for more detail — one or more may be experiencing a hotspot.
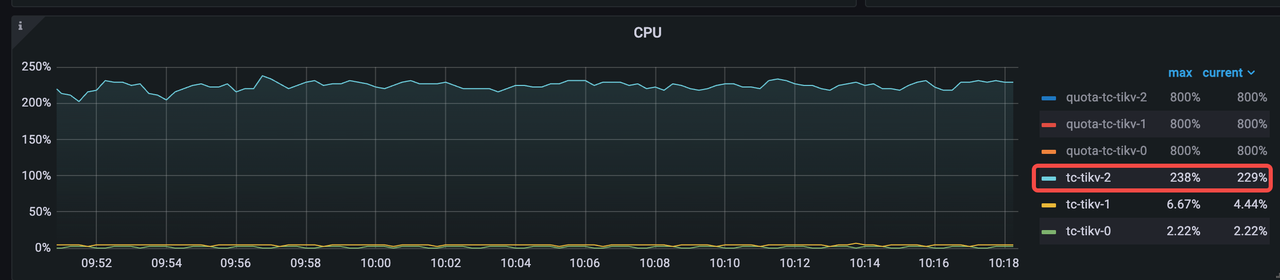
In the example above, tikv-2 shows much higher CPU usage than its peers — a clear red flag.
Analyze Top SQL Data
Top SQL highlights the SQL queries putting the most pressure on the cluster. This makes it easier to determine whether a specific query is responsible for a hotspot.
- Open the TiDB Dashboard and navigate to the Top SQL section.
- Look for queries that consistently appear at the top of the CPU usage list.
- Optimize the query or consider redistributing the data if needed.
New in TiDB 8.5: Top SQL can now aggregate by table, not just by query. This is useful when multiple variations of a query all hit the same table and collectively create a hotspot.
Example: Identify Query-Level or Table-Level Hotspots
Suppose you notice that a specific SQL query is always at the top of the CPU usage list. That’s a strong signal it may be causing a hotspot. Optimizing that query—or rebalancing the data it touches—can help relieve pressure on the cluster.
If the query view alone doesn’t surface the full picture, TiDB 8.5 introduces table-level aggregation in Top SQL. This makes it easier to see which tables are associated with high resource consumption.
TiDB Performance Hotspots: Use System Tables to Identify Hot Regions
If TiKV CPU or Top SQL data suggests a hotspot but doesn’t explain where or why it’s happening, TiDB’s system tables can help trace the issue further by surfacing hot regions.
If Top SQL is disabled or doesn’t show enough detail, system tables offer an alternative way to pinpoint problematic regions or workloads.
These tables are especially helpful when:
- You’re seeing imbalanced load across nodes with no obvious query culprit.
- You want to correlate real-time or historical hotspot data to pinpoint problematic tables or partitions.
Here are the key tables:
| Table Name | Purpose |
| TIDB_HOT_REGIONS | Shows active hot regions with flow rate and load degree |
| TIDB_HOT_REGIONS_HISTORY | Tracks past hot regions to support time-based analysis |
| TIKV_REGION_PEERS | Maps regions to TiKV stores and leaders |
| TIKV_STORE_STATUS | Helps correlate stores to specific TiKV nodes |
Example: Identify Current Hot Regions
To find which regions are generating the most traffic, use this query:
SELECT h.DB_NAME, h.TABLE_NAME, h.INDEX_NAME, h.REGION_ID,
       s.ADDRESS AS LEADER_ADDRESS, h.TYPE, h.MAX_HOT_DEGREE,
       h.REGION_COUNT, h.FLOW_BYTES
FROM information_schema.TIDB_HOT_REGIONS AS h
JOIN information_schema.TIKV_REGION_PEERS AS p ON h.REGION_ID = p.REGION_ID
JOIN information_schema.TIKV_STORE_STATUS AS s ON p.STORE_ID = s.STORE_ID
WHERE p.IS_LEADER = 1
ORDER BY h.FLOW_BYTES DESC
LIMIT 10;

+-----------------------+------------+------------+-----------+-------------------------------------------------------------+------+----------------+--------------+------------+
| DB_NAME               | TABLE_NAME | INDEX_NAME | REGION_ID | LEADER_ADDRESS                                              | TYPE | MAX_HOT_DEGREE | REGION_COUNT | FLOW_BYTES |
+-----------------------+------------+------------+-----------+-------------------------------------------------------------+------+----------------+--------------+------------+
| rg_sbtest_32_10000000 | sbtest24   | NULL       |      2196 | tc-tikv-2.tc-tikv-peer.csn-resource-control-dd5g6.svc:20160 | read |           2797 |            0 |       8138 |
| rg_sbtest_32_10000000 | sbtest30   | NULL       |       880 | tc-tikv-1.tc-tikv-peer.csn-resource-control-dd5g6.svc:20160 | read |           2831 |            0 |          0 |
| rg_sbtest_32_10000000 | sbtest26   | NULL       |      1548 | tc-tikv-2.tc-tikv-peer.csn-resource-control-dd5g6.svc:20160 | read |            145 |            0 |          0 |
+-----------------------+------------+------------+-----------+-------------------------------------------------------------+------+----------------+--------------+------------+
3 rows in set (0.46 sec)
This query highlights the Top 10 hot regions by traffic (FLOW_BYTES), along with the responsible table, index, and TiKV leader node.
Analyze Historical Hotspots
Sometimes performance issues only show up during specific periods — high-traffic spikes, batch jobs, or off-peak activity. That’s where the TIDB_HOT_REGIONS_HISTORY table comes in. It helps identify when and where hotspots appeared, so you can spot patterns that real-time metrics might miss.
This is especially helpful when:
- You need to correlate performance slowdowns with traffic surges.
- You’re diagnosing intermittent issues that aren’t visible during live analysis.
Example: Identify Hot Tables During Peak Traffic
To find which tables had the highest traffic in the last 30 minutes:
SELECT DB_NAME, TABLE_NAME, AVG(FLOW_BYTES) AS FLOW_BYTES
FROM INFORMATION_SCHEMA.TIDB_HOT_REGIONS_HISTORY
WHERE update_time > DATE_SUB(NOW(), INTERVAL 30 MINUTE)
  AND STORE_ID = "1249"
GROUP BY DB_NAME, TABLE_NAME
ORDER BY FLOW_BYTES DESC
LIMIT 20;
Example: Identify Hot Tables During Off-Peak Periods
You can also use off-peak periods to spot background load or unexpected hotspots that create hotspots:
SELECT DB_NAME, TABLE_NAME, AVG(QUERY_RATE) AS QUERY_RATE
FROM INFORMATION_SCHEMA.TIDB_HOT_REGIONS_HISTORY
WHERE update_time BETWEEN DATE_SUB(NOW(), INTERVAL 270 MINUTE)
                     AND DATE_SUB(NOW(), INTERVAL 240 MINUTE)
  AND STORE_ID = "1249"
GROUP BY DB_NAME, TABLE_NAME
ORDER BY QUERY_RATE DESC
LIMIT 20;
These historical views are powerful for root cause analysis and capacity planning — especially in complex, multi-tenant environments where patterns matter more than snapshots.
Conclusion
Hotspots are one of the most common — and most frustrating — causes of performance issues in distributed systems. But with the right tools, they don’t have to stay mysterious.
TiDB gives you multiple ways to surface and understand hotspots — from TiKV CPU metrics to Top SQL and system tables that show where the traffic really lands. And with TiDB 8.5, you get even deeper visibility, including table-level insights that make troubleshooting faster and more targeted.
Solving today’s problems is just the start. In an upcoming post, we’ll explore how AI agents and LLMs can turn hotspot detection into something proactive — not reactive.
We’re always refining and sharing what we learn — if you have any questions, please feel free to connect with us on Twitter, LinkedIn, or through our Slack Channel.
Experience modern data infrastructure firsthand.


TiDB Cloud Dedicated
A fully-managed cloud DBaaS for predictable workloads
TiDB Cloud Serverless
A fully-managed cloud DBaaS for auto-scaling workloads