
Introduction to TiDB Performance Tuning
Importance of Performance Tuning in Distributed Databases
Performance tuning is crucial for maintaining optimal performance in distributed databases. As databases grow, they encounter various challenges such as concurrent user access, complex query executions, and large data volumes. Tuning ensures that these challenges do not degrade performance. With the increasing data-performance needs in modern applications, particularly for mission-critical operations, effective database performance tuning becomes indispensable. It involves systematically enhancing database performance by focusing on specific metrics and applying advanced strategies to mitigate potential bottlenecks.
Overview of TiDB’s Architecture and Performance Characteristics
TiDB is a high-performance distributed SQL database that excels in scaling horizontally, providing strong consistency, and handling massive data volumes. It is based on the Raft consensus algorithm, ensuring data consistency and high availability. TiDB’s architecture consists of three main components:
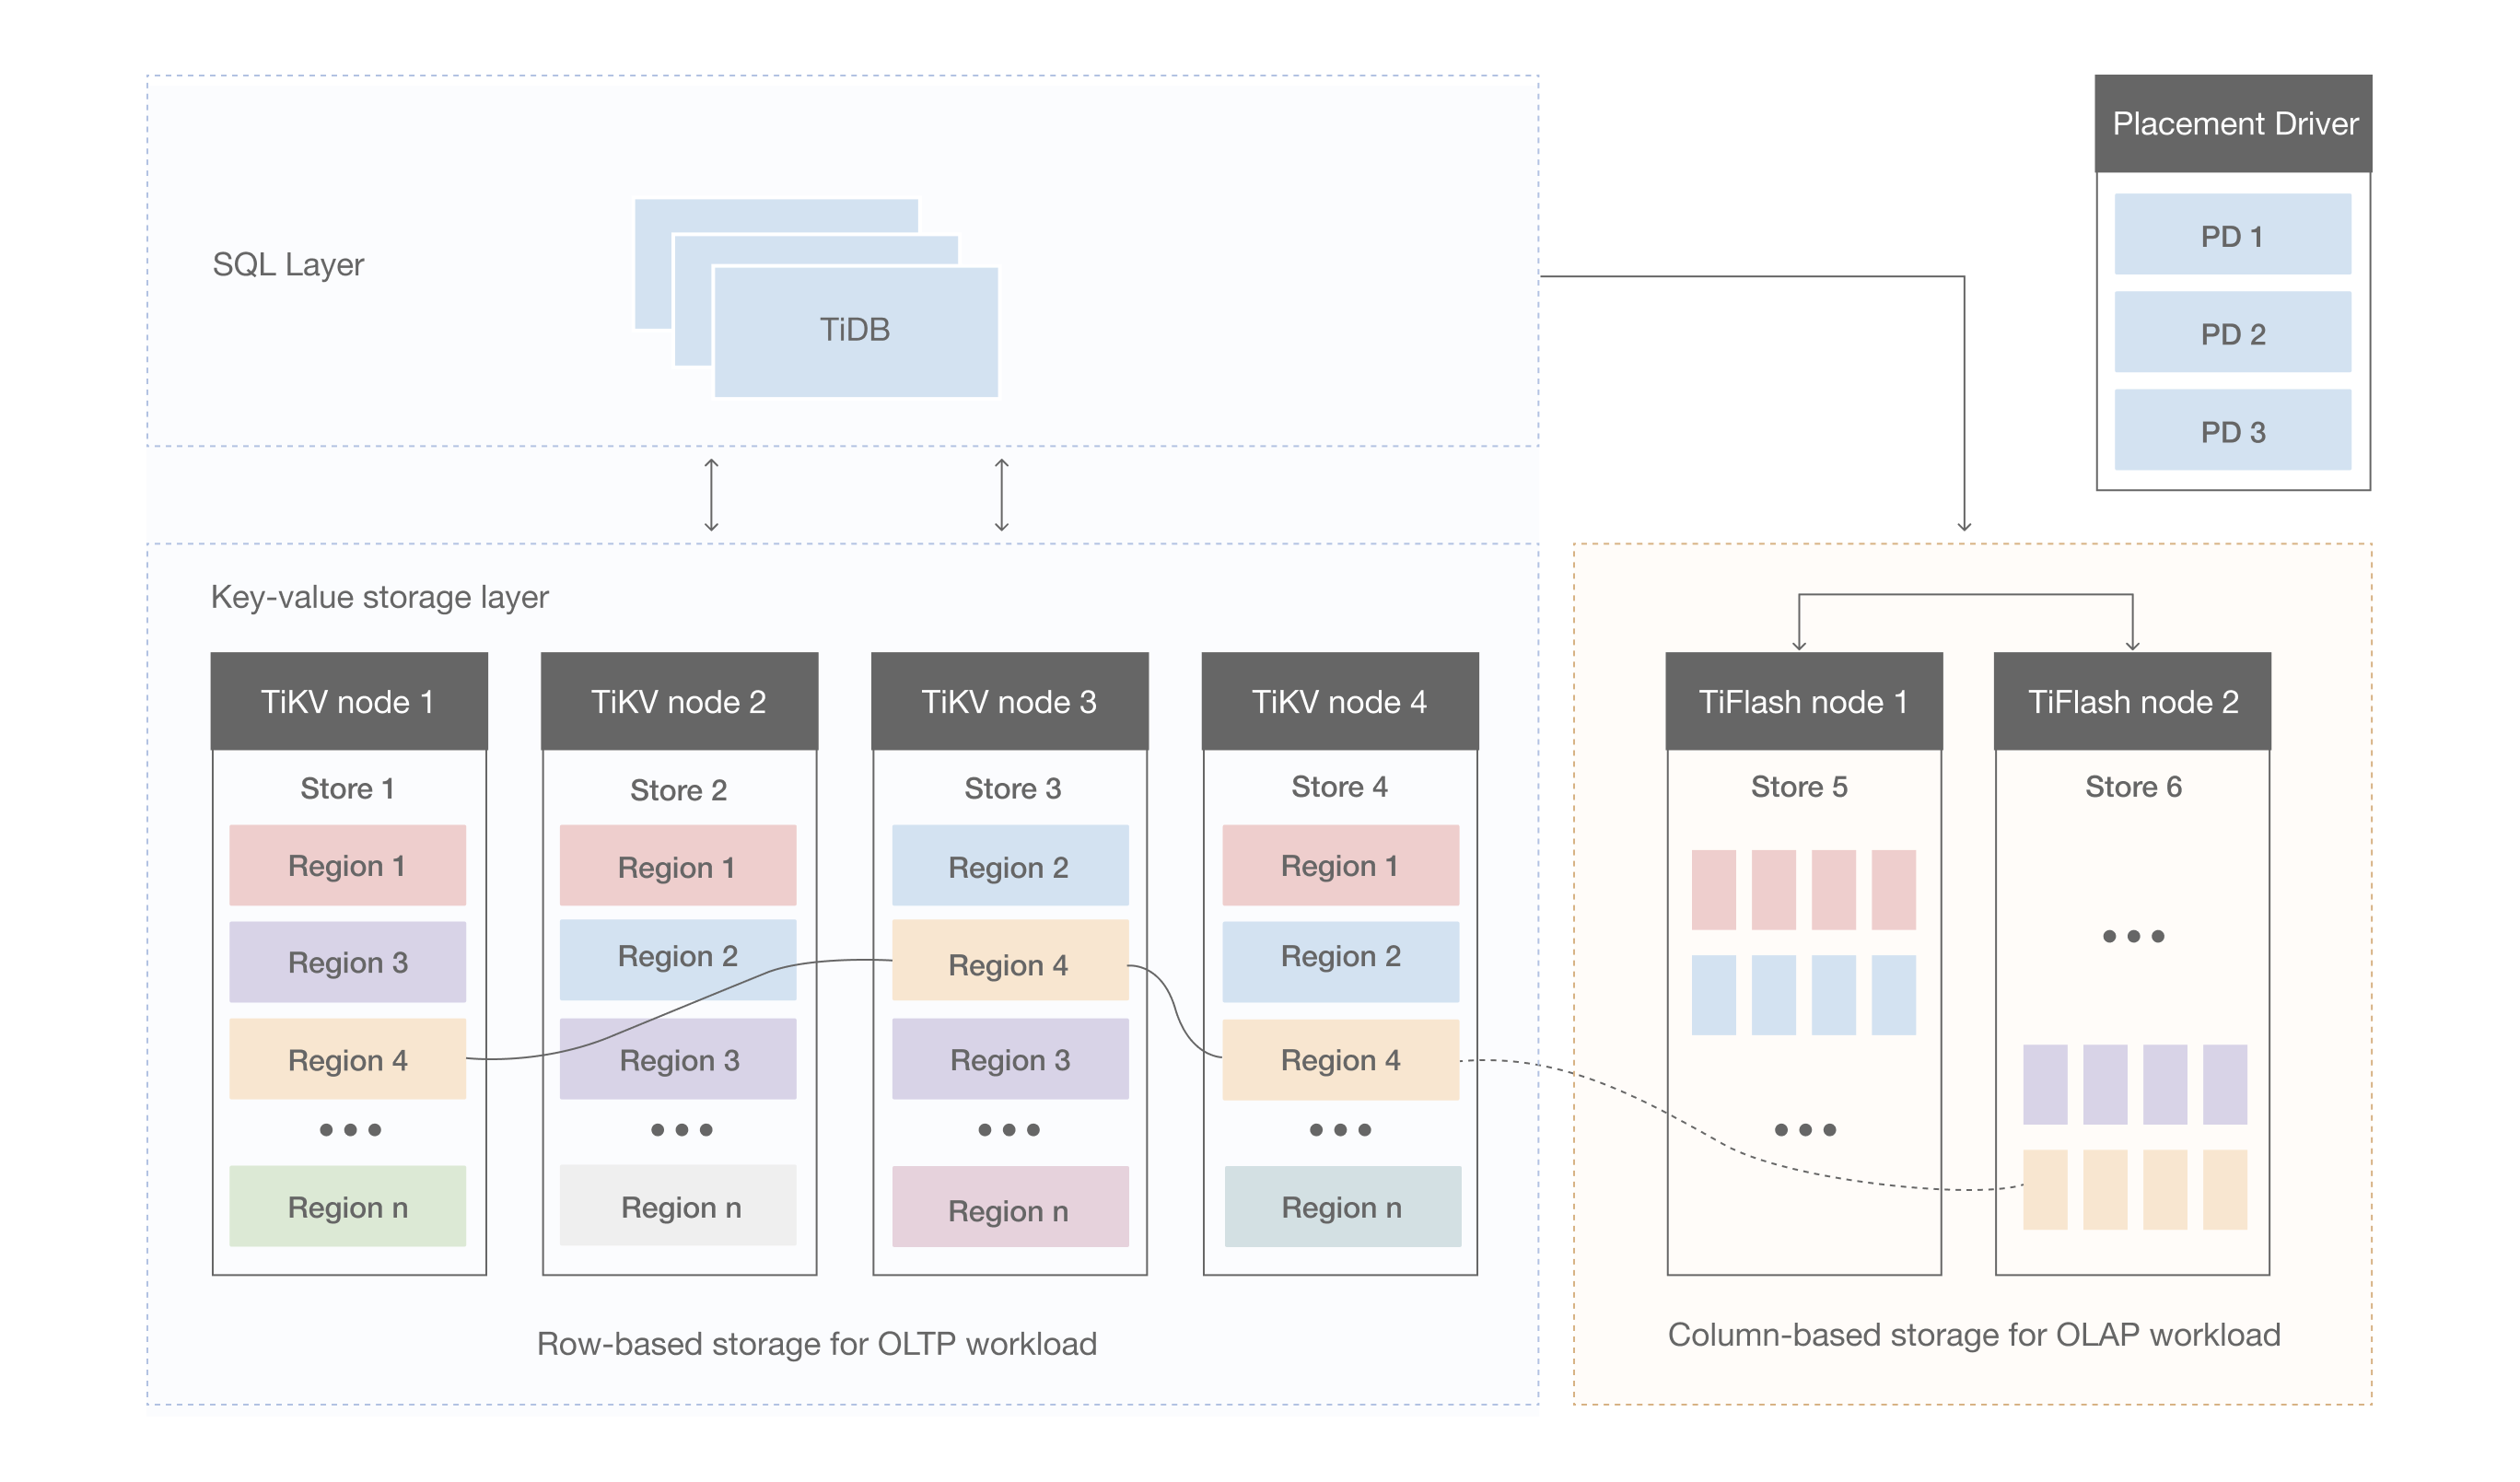
- TiDB Server: This layer serves as the SQL processing engine, handling SQL parsing, query optimization, and execution.
- PD (Placement Driver) Server: This component manages the cluster’s metadata, making decisions on data placement and providing global consistency timestamps.
- TiKV Server: TiKV is a distributed storage engine that stores data in highly available and consistent KV pairs.
For analytical workloads, TiDB can integrate with TiFlash, a columnar storage interface designed to handle large-scale OLAP queries efficiently. TiFlash nodes replicate data from TiKV, transforming row-based data into a columnar format to allow high-performance analytics.
Key Performance Metrics to Monitor in TiDB
When tuning TiDB, it’s essential to monitor various performance metrics that reflect the system’s health and efficiency. Critical metrics include:
- Query Latency: The time taken for a query to execute from start to finish. This metric helps identify slow queries needing optimization.
- Throughput: Measured in transactions per second (TPS) or queries per second (QPS), this reflects the system’s capacity to handle operations.
- CPU Usage: High CPU usage can indicate a heavy load or inefficient queries, necessitating resource management and optimization.
- Memory Usage: Monitoring memory usage ensures that the system has sufficient resources to handle operations without paging or thrashing.
- Disk I/O: Inadequate disk I/O performance can result in slow data retrieval and storage operations, thus optimizing disk usage is crucial.
- Network Latency: Ensures efficient data exchange between distributed components, critical for maintaining overall performance.
Monitoring these metrics provides insights into where potential performance issues may reside, guiding targeted optimization efforts.
Core Performance Tuning Techniques
Query Optimization (Indexes, Partitioning, Execution Plans)
Indexes
Indexes are central to fast query performance. They should be strategically applied to columns frequently involved in SELECT, JOIN, WHERE, and ORDER BY clauses:
CREATE INDEX idx_title ON books (title);
Indexes like primary keys and unique indexes help enforce constraints efficiently while also aiding quick lookups. However, over-indexing can cause query slowdowns on write-heavy operations, so index management must balance read and write performance.
Partitioning
Partitioning breaks a large table into smaller, more manageable pieces, improving performance and manageability. TiDB supports range and hash partitioning:
ALTER TABLE orders
PARTITION BY RANGE (order_date) (
    PARTITION p0 VALUES LESS THAN (2021-01-01),
    PARTITION p1 VALUES LESS THAN (2022-01-01)
);
Partitioning helps optimize queries that scan large tables by reducing the data scanned.
Execution Plans
Understanding and optimizing execution plans can significantly improve query performance. Tools like EXPLAIN analyze the query optimizer’s behavior and suggest efficient query plans:
EXPLAIN SELECT title, price FROM books WHERE title = 'TiDB in Action';
Analyzing the output helps identify bottlenecks, such as full table scans, which can then be mitigated by using appropriate indexes or rewriting queries.
Resource Allocation and Management (CPU, Memory, Disk I/O)
Effective resource allocation and management are critical to maintaining optimal TiDB performance.
CPU Management
Configuring TiDB to effectively utilize CPU resources involves adjusting concurrency settings and query execution parameters. Monitoring CPU usage using tools like TiDB’s Performance Dashboard helps in identifying CPU bottlenecks and optimizing the load distribution across nodes.
Memory Management
Memory management involves configuring buffer pools and cache sizes to optimize data retrieval speeds. TiDB supports configuring the tidb_mem_quota_query parameter to manage memory usage for individual queries, preventing memory exhaustion:
SET SESSION tidb_mem_quota_query = 32 * 1024 * 1024; -- 32 MB
Disk I/O
Optimal disk performance is vital for database performance. Configurations such as innodb_io_capacity and ensuring high-performance SSDs can enhance I/O operations. Monitoring tools help track disk latency and throughput, helping identify and rectify I/O bottlenecks.
Configuration Tuning (Optimizer Hints, System Variables)
Optimizer Hints
Optimizer hints provide the TiDB query planner with directives to optimize the execution of specific queries. They guide the query optimizer to choose the most efficient execution plan:
SELECT /*+ HASH_JOIN(t1, t2) */ t1.name, t2.salary FROM employees t1 JOIN salaries t2 ON t1.id = t2.id;
System Variables
TiDB provides a wide array of configurable system variables that control various aspects of database performance:
tidb_distsql_scan_concurrency: Adjusts concurrent scans, affecting parallel query execution.tidb_index_lookup_join_concurrency: Limits concurrency for index lookup joins, balancing load between nodes.
Modifying these variables based on system requirements and workloads ensures optimal performance.
Advanced Performance Tuning Strategies
Use of TiDB’s Built-in Profiling and Monitoring Tools
TiDB offers comprehensive profiling and monitoring tools to diagnose performance issues and tune system parameters effectively. Key tools include:
Slow Query Logs
TiDB’s slow query logs capture slow-running queries, providing insights into problematic areas:
SHOW SLOW TOP 10;
TiDB Dashboard
This tool provides real-time monitoring and historical data visualization for performance metrics such as QPS, latency, and resource usage. Features like Top SQL and Continuous Profiling enhance visibility into query execution and resource consumption.
Leveraging TiFlash for Analytical Workloads
TiFlash is TiDB’s columnar storage engine designed for high-performance analytical queries:
Real-Time Analytical Processing
TiFlash provides real-time sync with TiKV, offering fresh data for analytical processing without compromising transaction processing performance. TiFlash uses MPP (Massively Parallel Processing) for optimizing heavy analytical workloads.
Configuring TiFlash
To utilize TiFlash, tables must be configured to create columnar replicas. This setup facilitates optimized query execution for analytical workloads:
ALTER TABLE sales ADD PLACEMENT POLICY = DEFAULT POLICY;
By strategically leveraging TiFlash, users can achieve robust OLAP capabilities integrated with OLTP, supporting hybrid transaction and analytical processing (HTAP).
Case Studies: Real-world Performance Tuning Scenarios in TiDB
Real-world scenarios highlight the practical applications of TiDB performance tuning techniques:
Case Study 1: Optimizing Large-scale OLTP Workloads
A fintech company faced performance degradation due to high transaction volumes. By leveraging partitioning and optimizing SQL queries with proper indexes, they reduced query execution times significantly. Additionally, configuring TiDB system variables for better memory and CPU management ensured sustained performance during peak loads.
Case Study 2: Accelerating Analytical Queries with TiFlash
An e-commerce platform required fast analytical processing for real-time business intelligence. Implementing TiFlash, they achieved high-performance analytics without disrupting transactional operations. Optimizing their data replication strategy and leveraging TiDB’s monitoring tools, they maintained data freshness and query performance.
Conclusion
TiDB performance tuning is an intricate process involving query optimization, effective resource management, and advanced configuration tuning. By leveraging TiDB’s built-in profiling and monitoring tools, and integrating TiFlash for analytical workloads, users can achieve robust performance even under complex and hybrid workloads. Real-world case studies further illustrate the potential improvements in performance and efficiency, reinforcing the significance of meticulous tuning in maintaining a high-performance distributed database system.